General statistics from the IRA Russian Twitter trolls
To introduce you to the Russian Twitter trolls, this page consists of many visualizations of basic statistics. How often did the trolls tweet? At which time of the day? Were they more active during the election? What is the highest amount of followers a troll has had?
These questions, and more, will be answered below.
Tweets over time
English tweets.
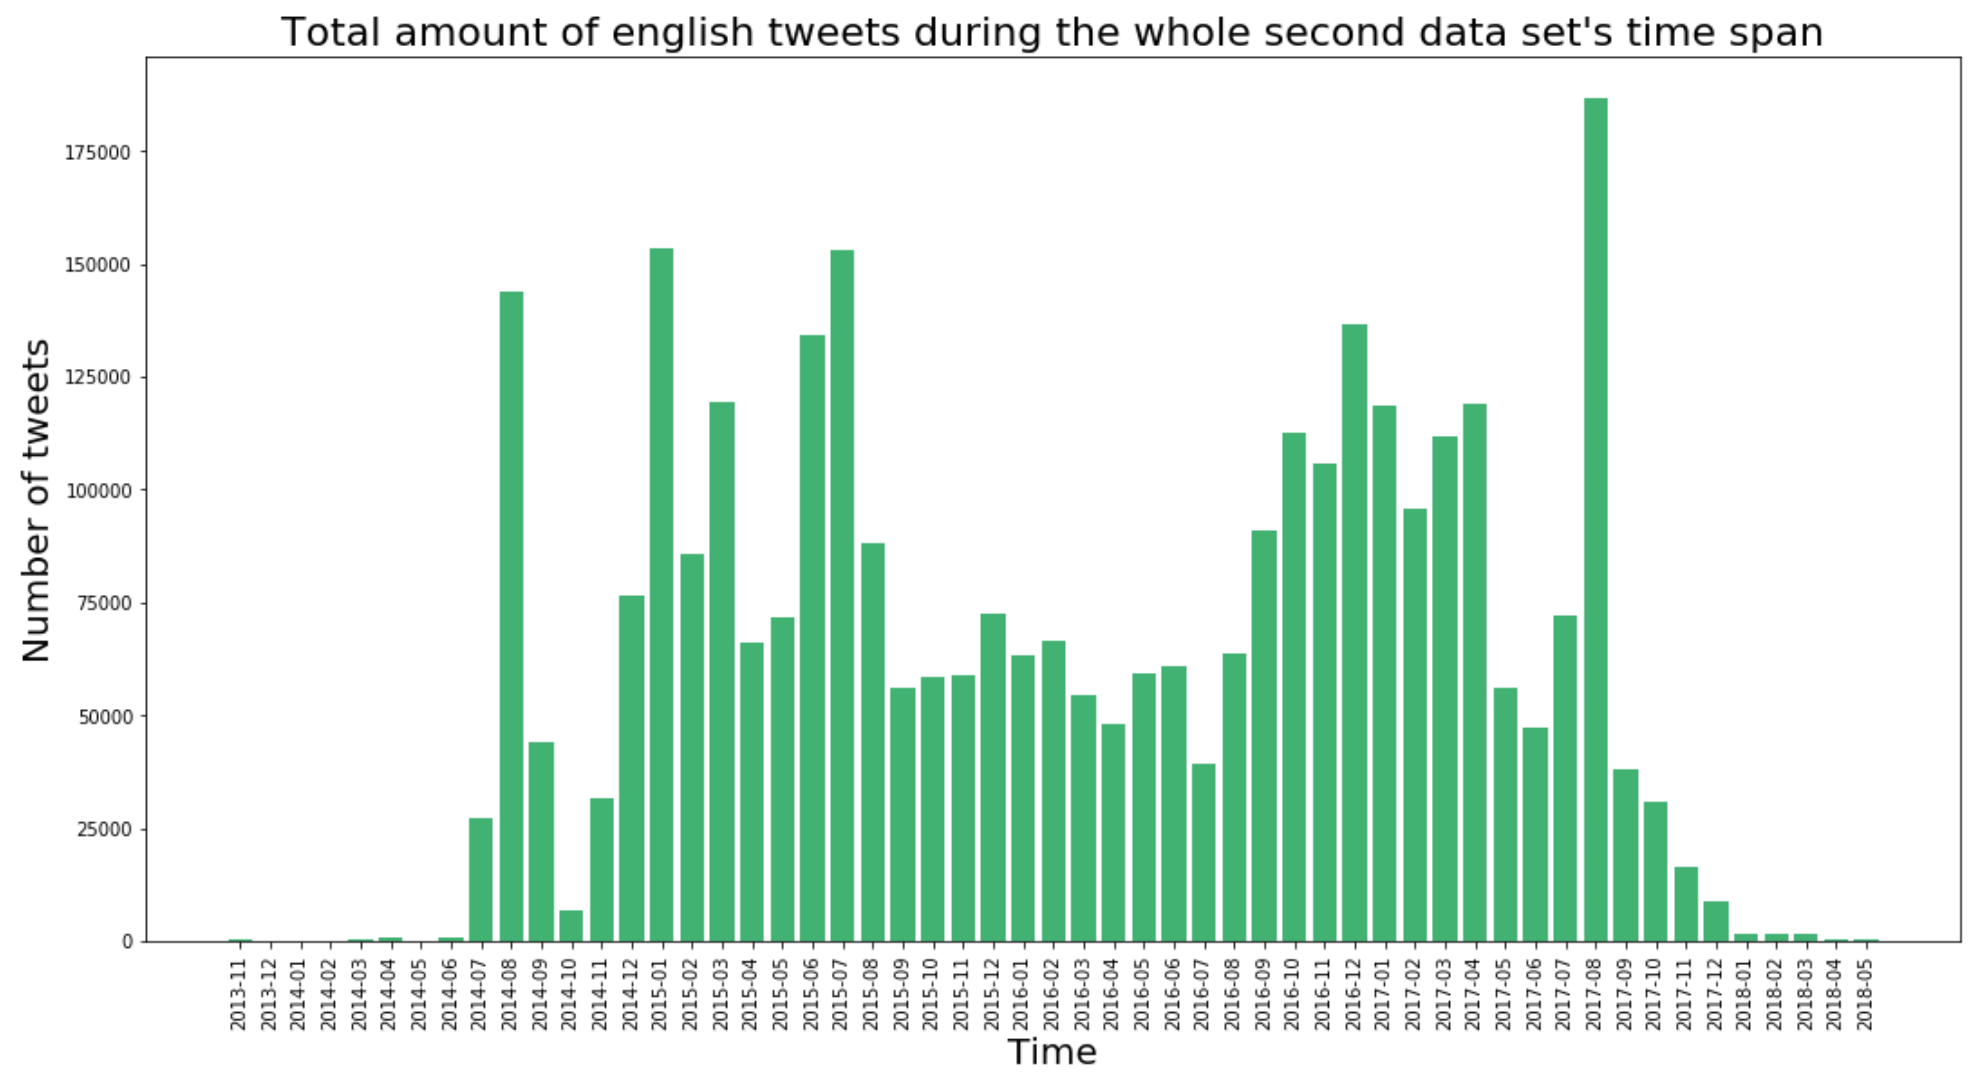
There were also tweets before November 2013, but only 400 in total.
The results shows that there were almost no english activity until 2014, with the first visible chart in november 2013. Activity had some high peaks in early 2015, before increasing in the months just before the election. It then peaked in december 2016 and decreased a little after that. Then there was a massive spike in August 2017. This was probably because of the Unite The Right rally in Charlottesville, also known as the Charlottesville riots, where e.g. a woman got killed by a white supremacist. You can read more about the tweets from this event in this Buzzfeed article.
Tweets in all languages.
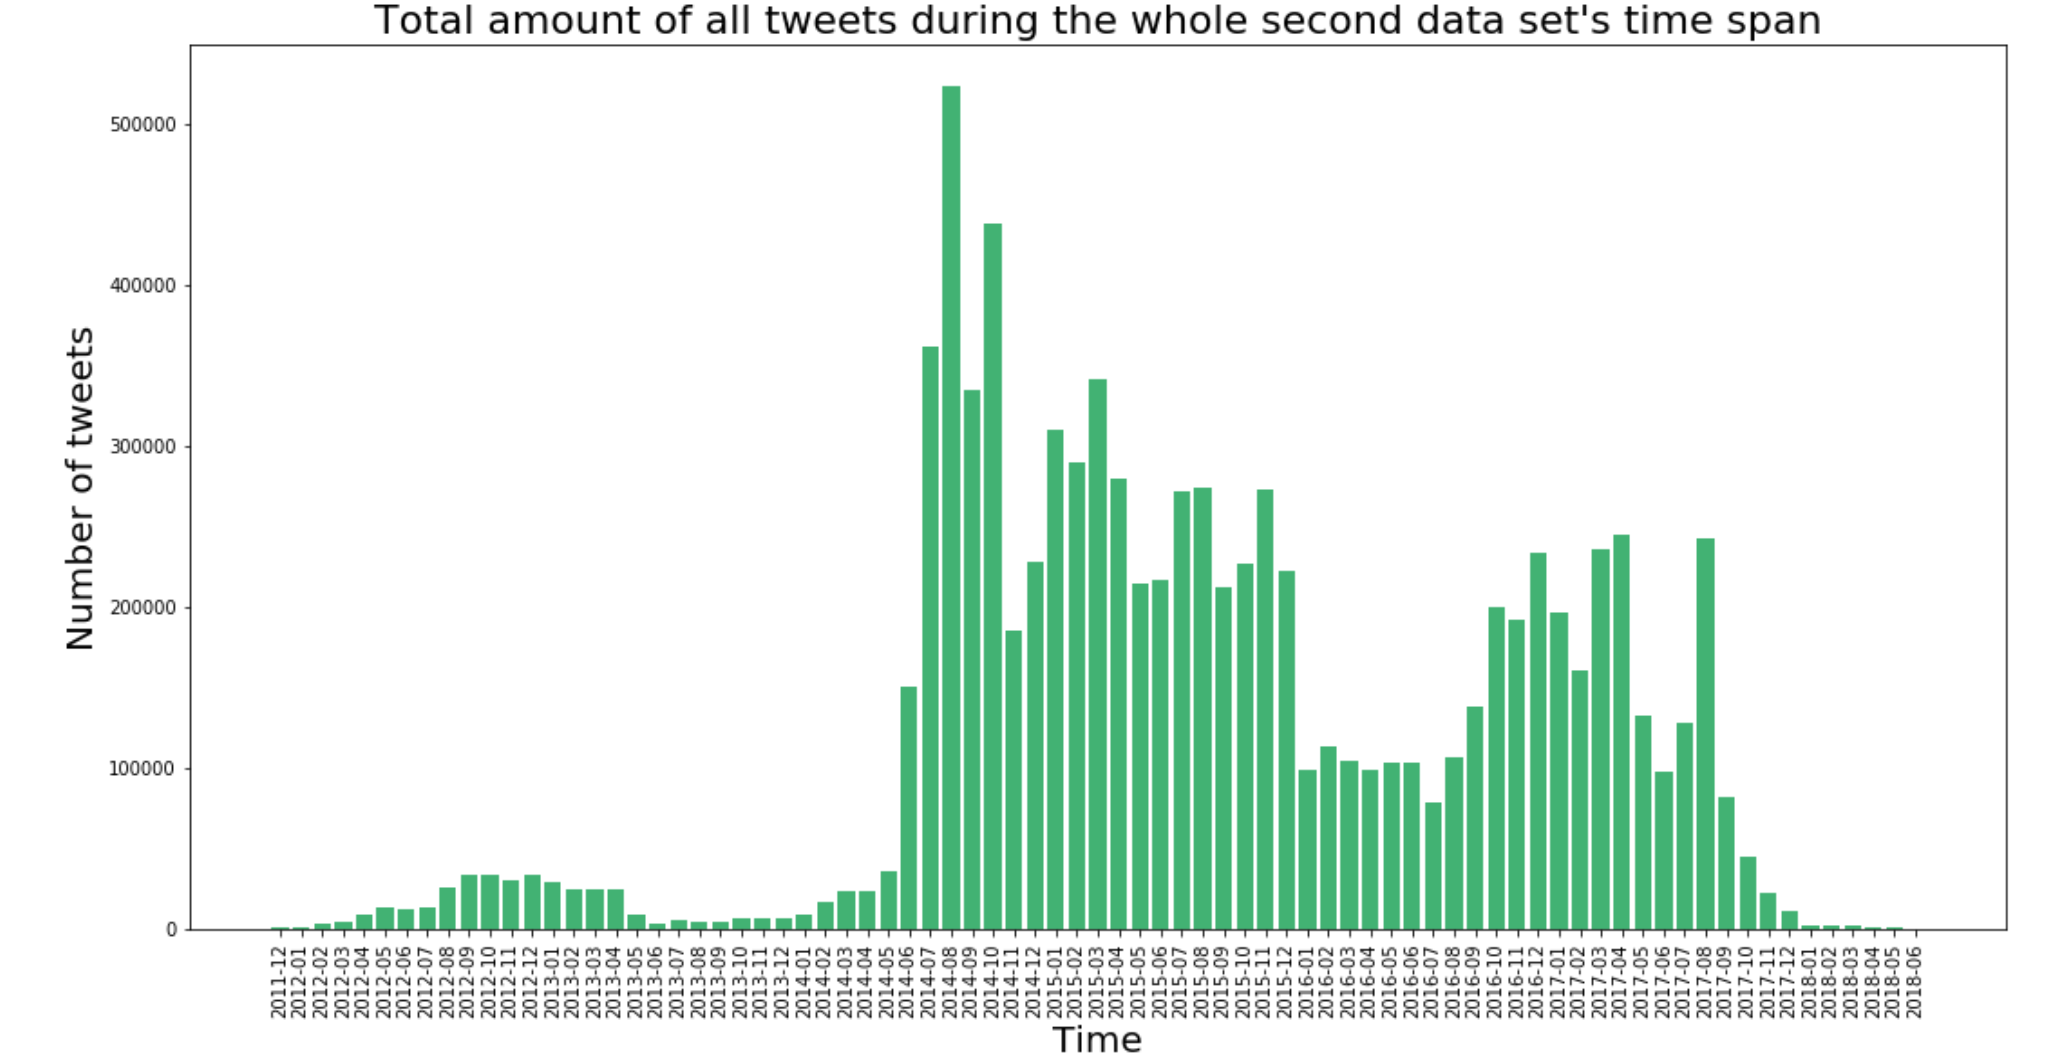
When comparing the two against each other, notice that the labels on the x-axis are different for each of the graphs.
The highest amount of all tweets actually appeared in 2014. The main difference is that most of the tweets in this period are in russian. Before the english tweets really sparked off, most russian trolls tweeted in their native language. This was in the period when the Ukrainian-Russian conflict was frequently in the media. It may be that the success of the tweeting in this period also started the activity in other regions. This is only speculations, but one thing can be said for sure: The russian trolls came before the english ones.
Before and after the primaries in US
One of the initial research questions we wanted to answer was if things had changed from the first time a candidate announced that he or she would run for president. How did the troll activity change throughout the political timeline of the American election. We are going to look at two different time periods: Before Clinton and Trump was elected as each of the two parties candidates, and after.
Before primaries
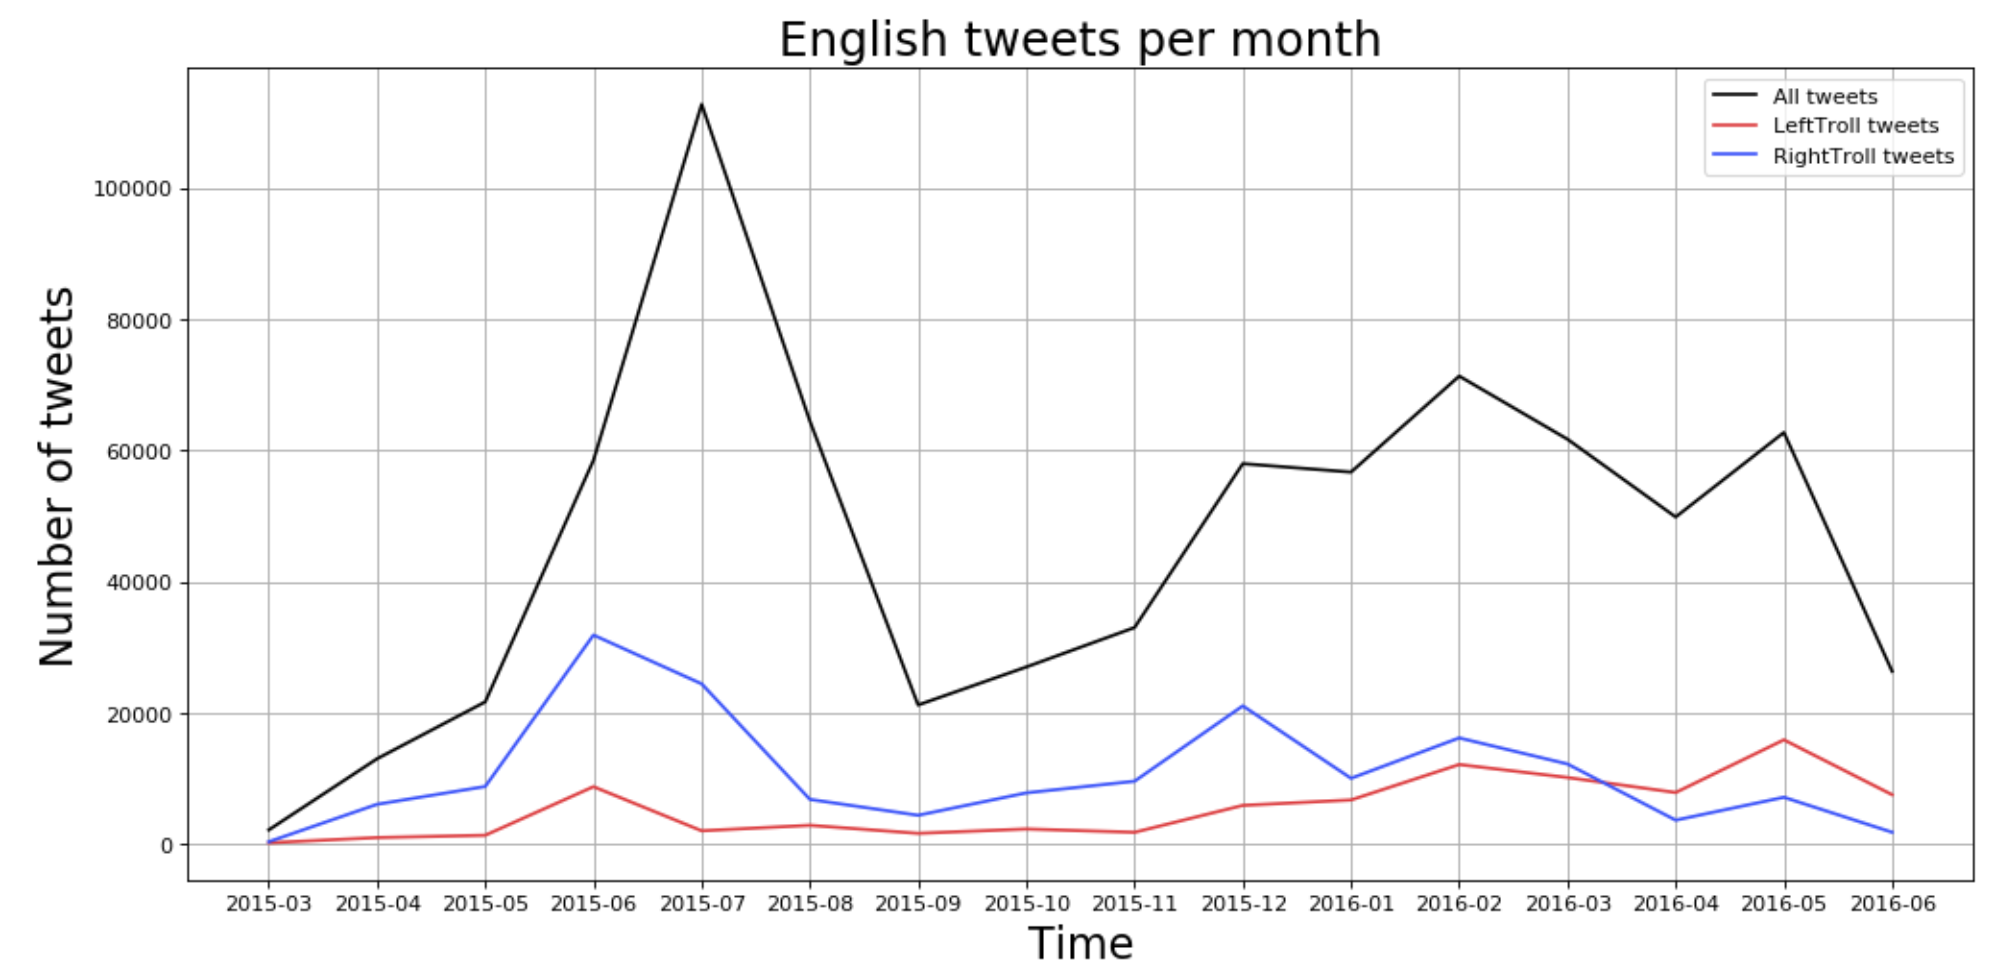 Things really sparked off when the first people started announcing their candidacies. In the beginning, there was an almost exponential growth of tweets. There are also several tweets that are not politically categorized as well.
After primaries
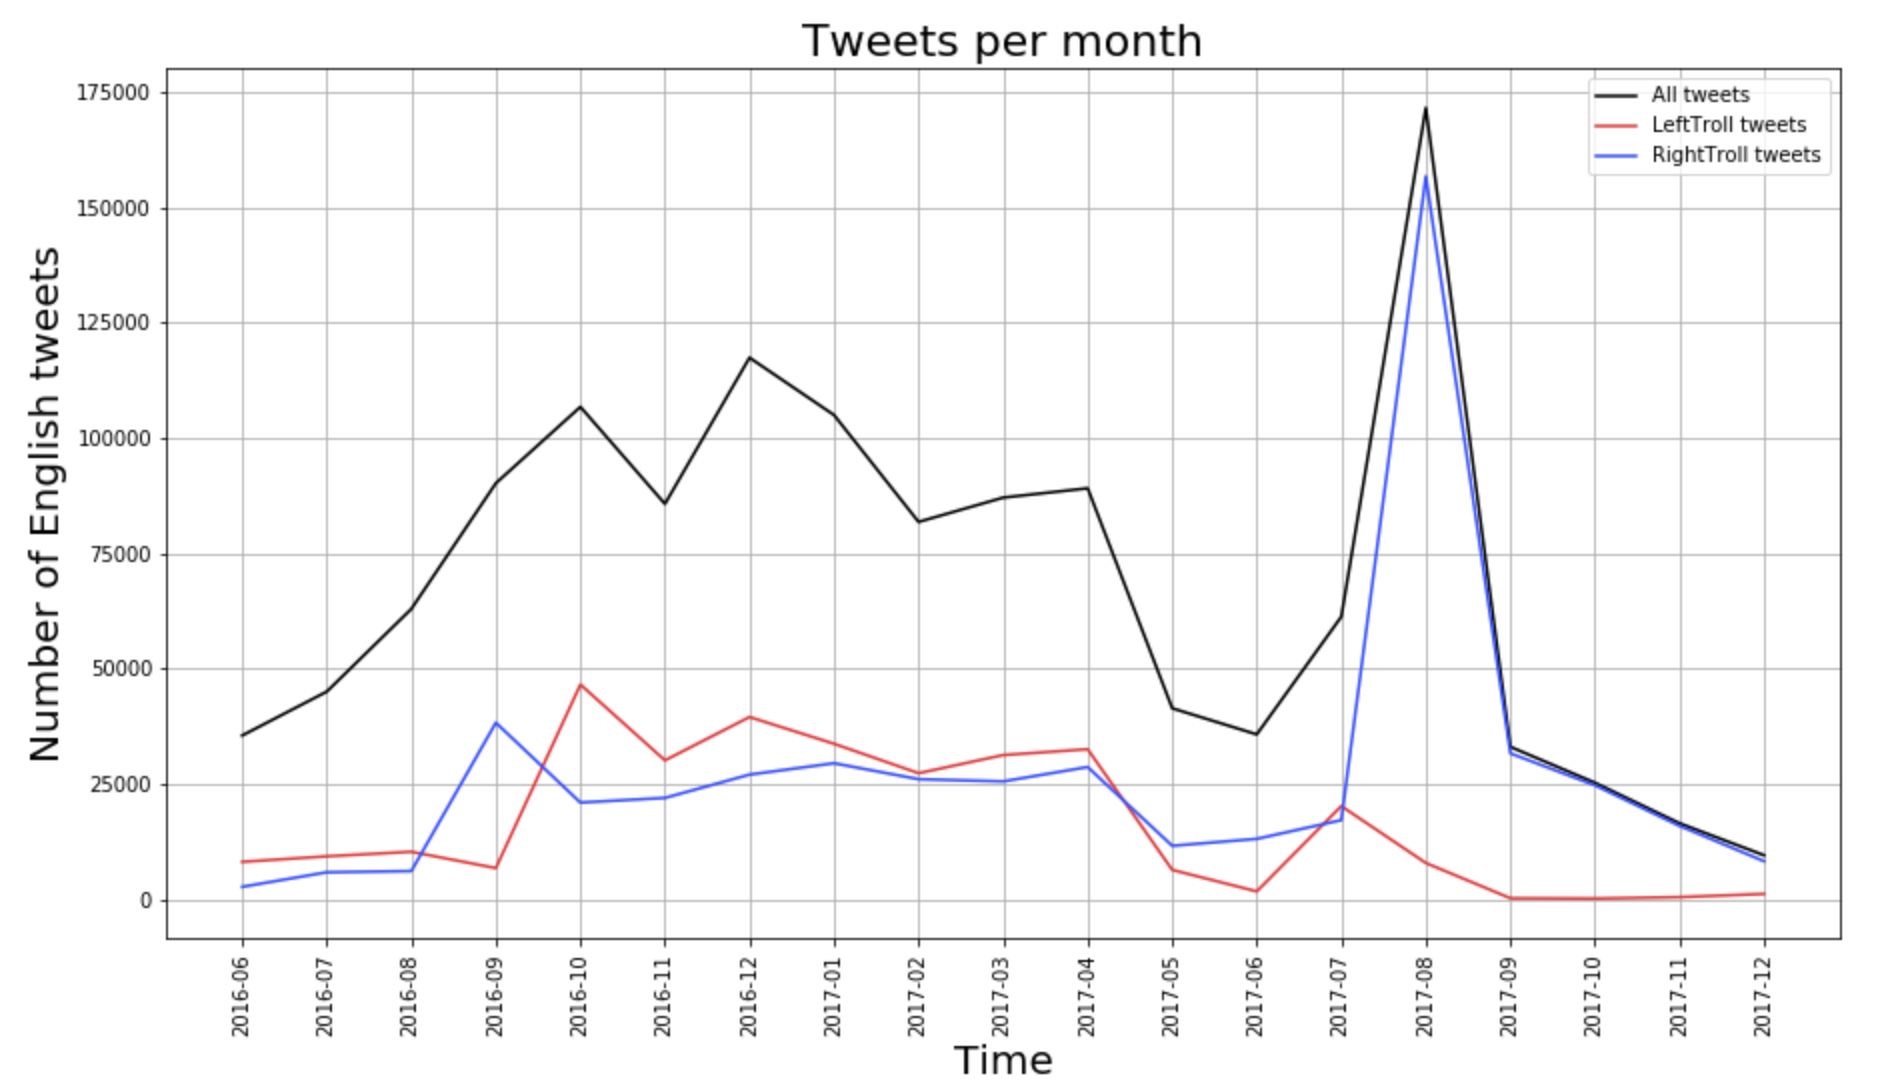 The trolls were surprisingly quiet the same month as the primary election, so the results of the primaries may not have been as significant as earlier thought.
The month of the main election and the period around this had a stable tweet amount from both sides. Leftist tweets actually dominated until May 2017, and after that there has almost only been activity from right trolls. Before the primaries the right trolls were the dominating ones, but we had a whole year where there were more left than right tweets.
It is hard to tell exactly why. It may have been a strategy to go harder for dividing the left side up to the election, but why left trolls kept on dominating after the election is somewhat a mystery to us. This may tell us that the specific strategies for the goals of Russia is not as easy to detract from the different troll categories, as it seems like there was a mixed political strategy in this phase.
From August 2017 the dataset consists almost exclusively of RightTroll tweets. From this point it seems like that they decided to shift their focus from a mixture of trolls to only fronting the right side.
Tweets per day (first dataset).
What about the spread of tweets throughout a day? May it be possible to detect some irregularities regarding the time differences between Russia and USA?
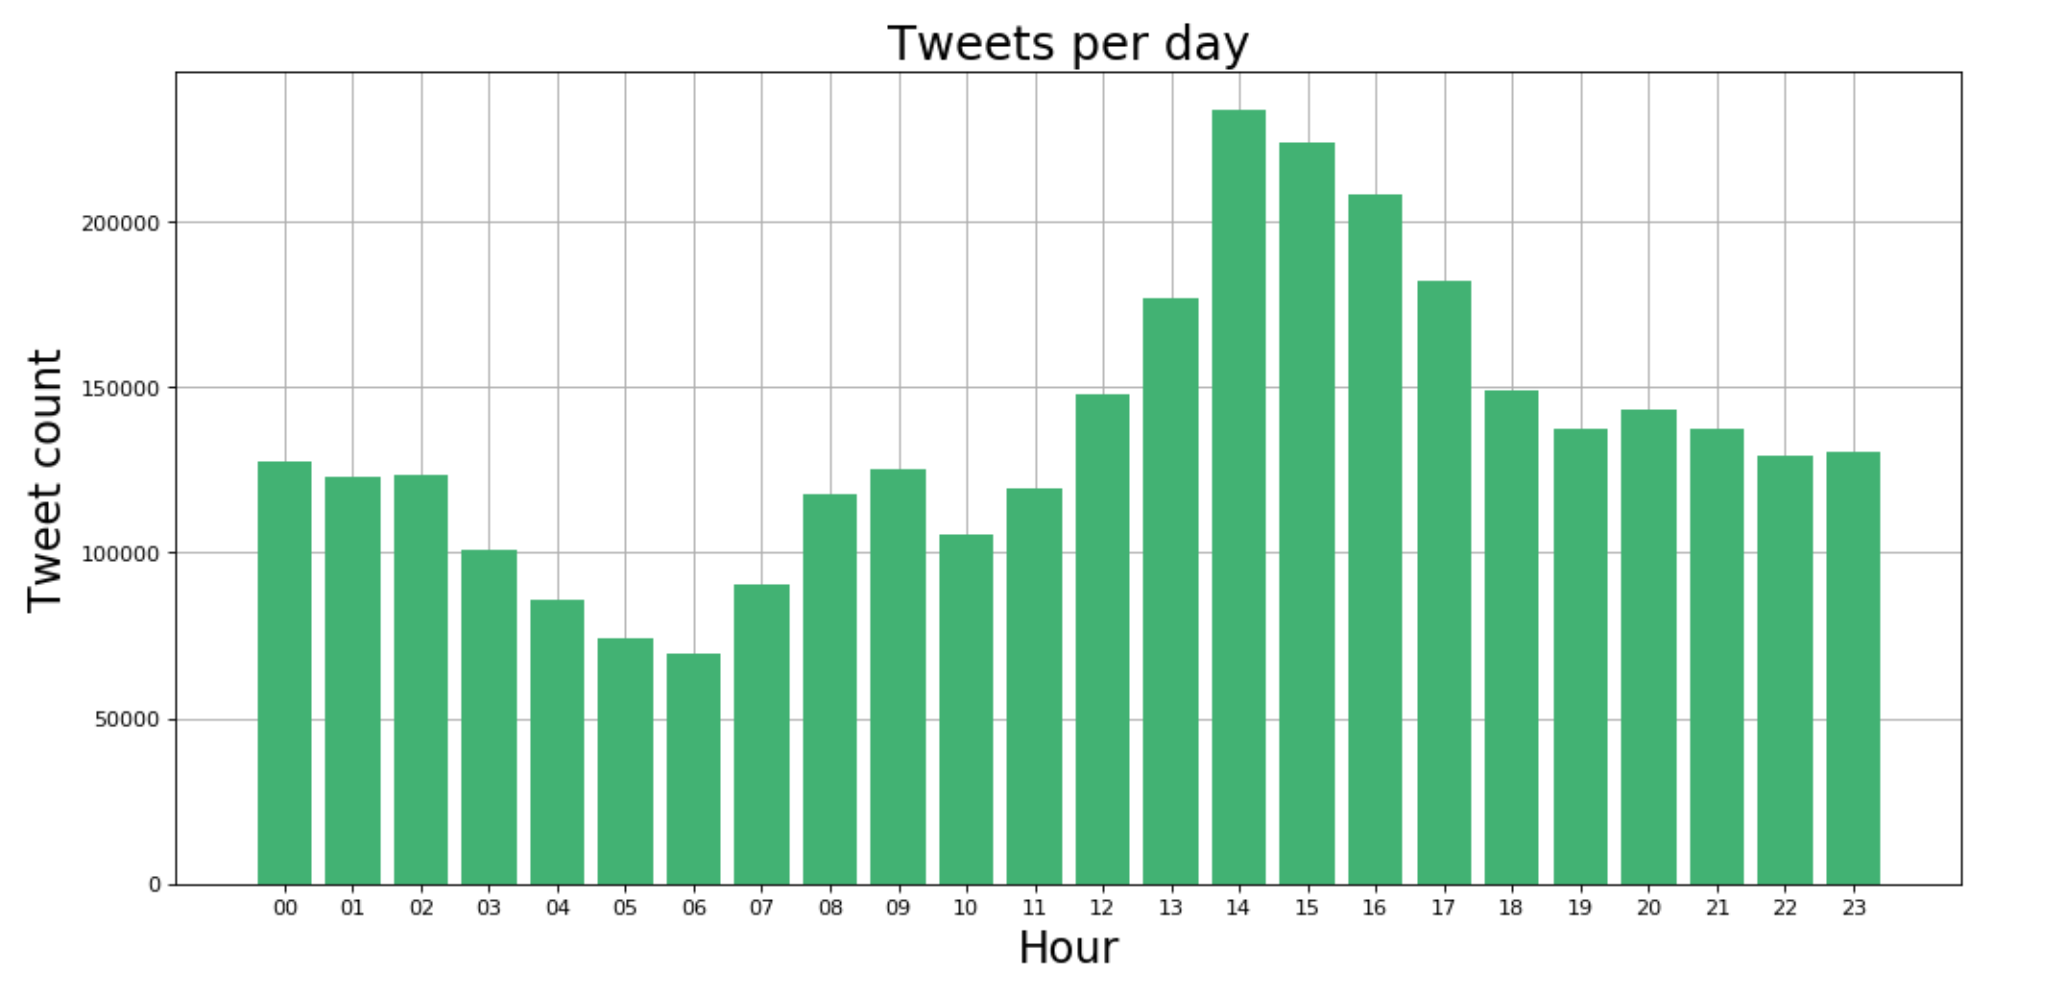
Notice that there are four different time zones in the US, and this is following Eastern American time.
Here the Russians have done a good job in timing the tweets. The tweets follows a good frequency regarding to when people are awake, and the majority of them are posted in the evening. The amount of tweets at midnight and in the early morning is a bit high, compared to actual tweet pattern through the day in the USA. Regardless of this, people would probably not question this too much if some of the goals are to mimic excessively tweeting political activists, spammers or internet warriors.
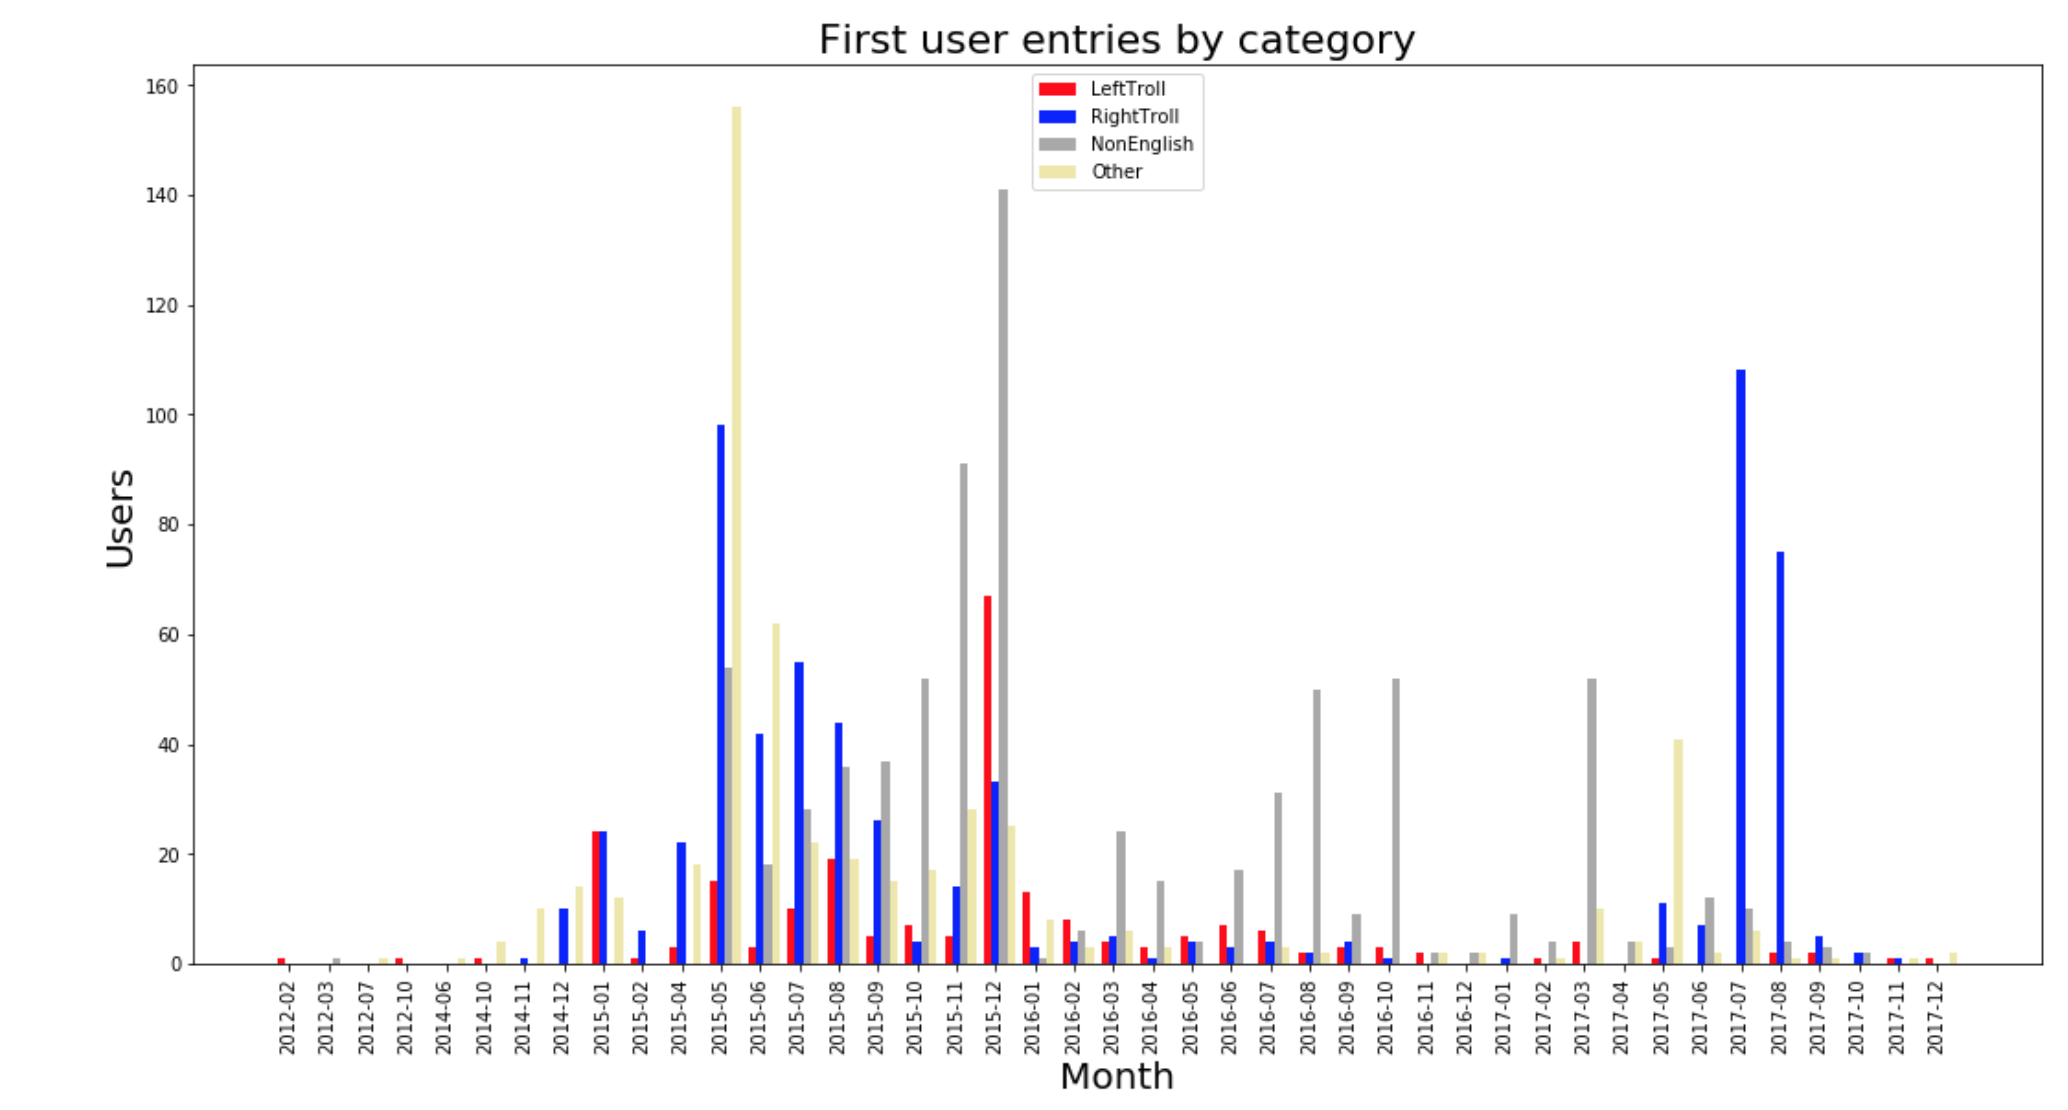
First appearances of users
The months that have the most tweets needs to be seen in light of how many trolls the IRA had created at that time. This part will visualize when the users first appeared.
English users
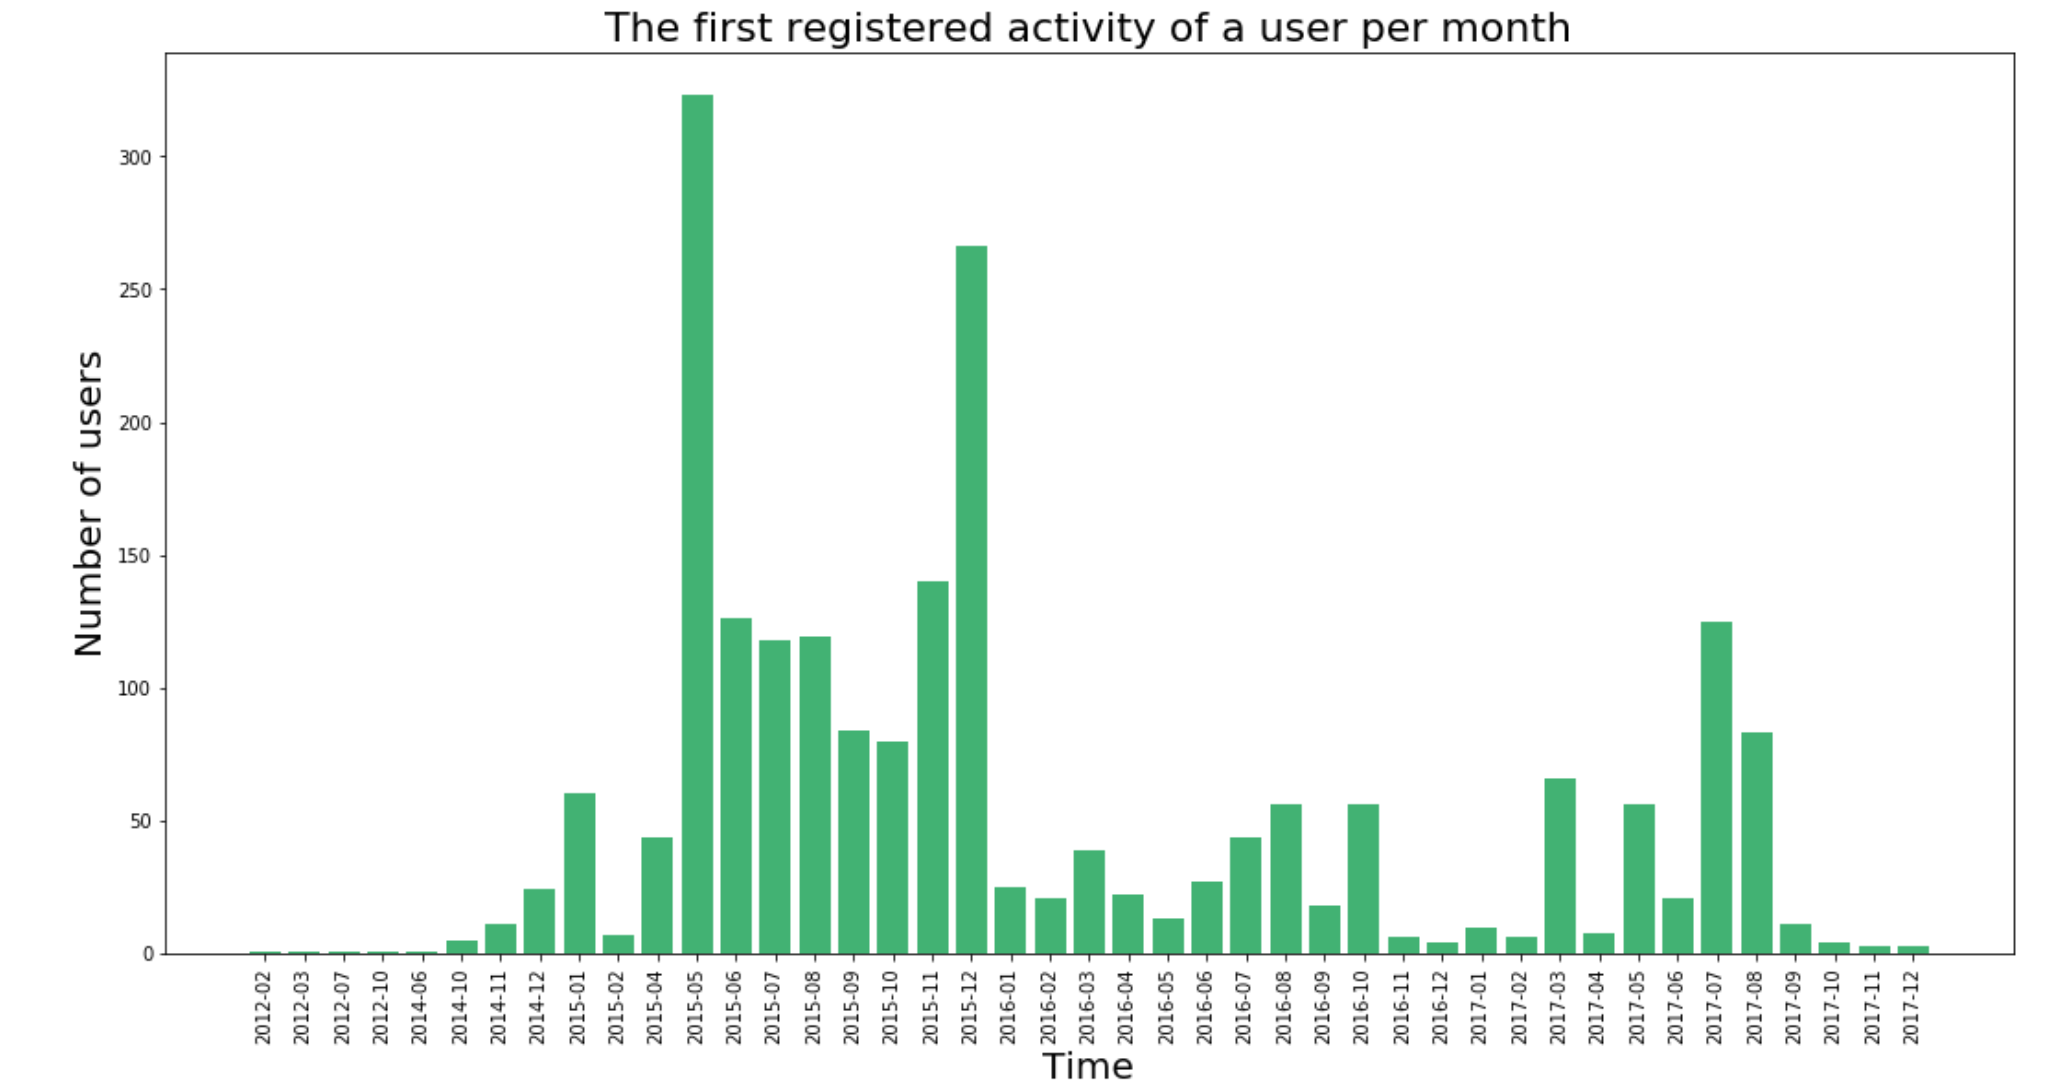
NB: Pay attention to the labels on the x-axis. Months with no introduction of new users are not included in this visualisation.
We can see here that most of the users first appear in 2015, after the primaries had started, and with a little spike in the summer of 2017 with the wave of RightTroll users.
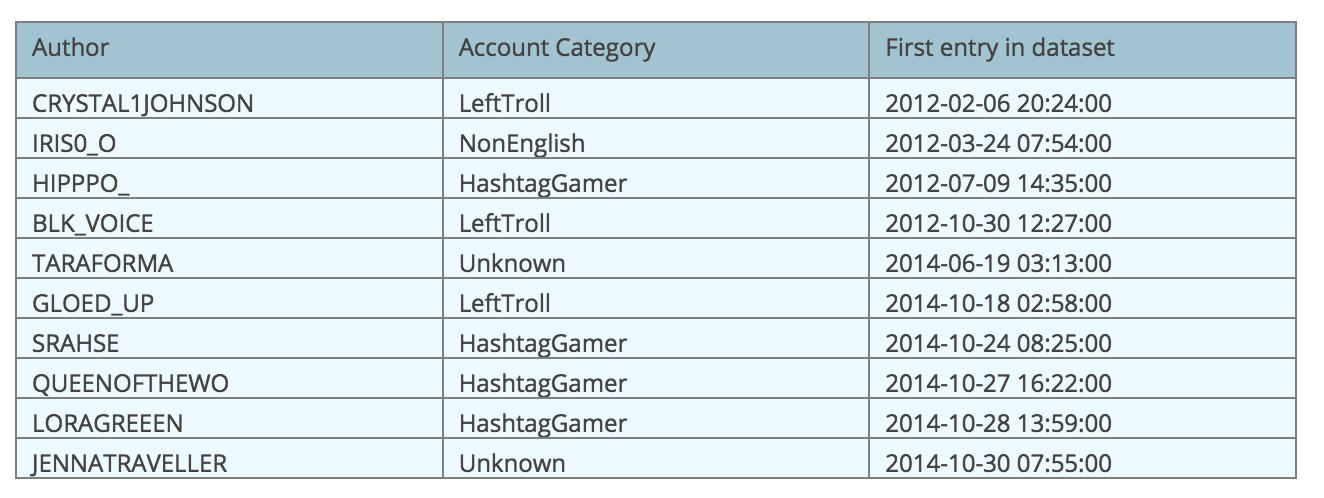
Why there are almost no tweets in the first dataset before november 2014 in the timeline is because there was almost no active english troll users in that period. As we can see in the following table, only ten users was registered before this time. Half of them were registered in the month before, and before that it looks rather sporadic with no first entried users in the year 2013.
All users
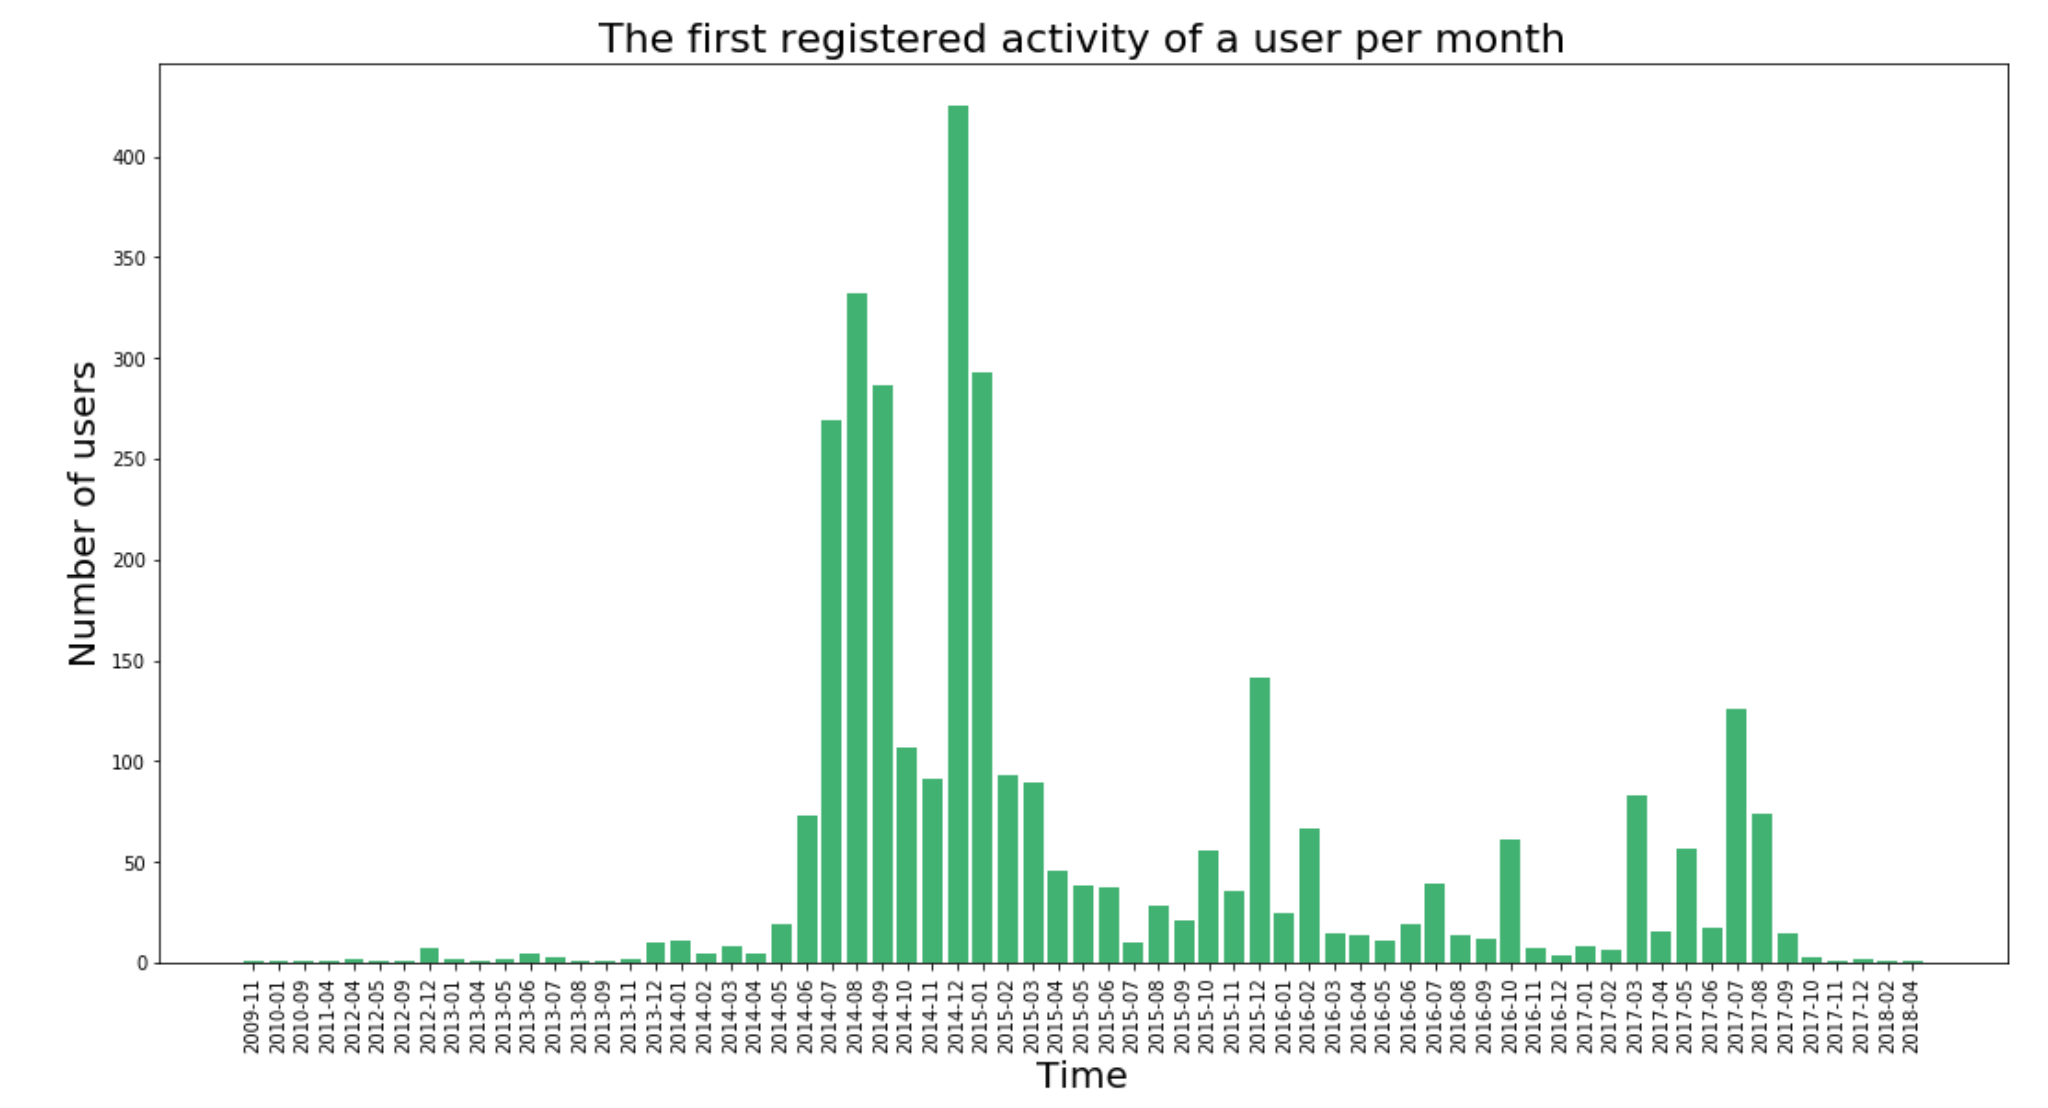
Again, pay attention to the labels on the x-axis.
In this visualization the extreme amount of Russian troll accounts made in 2014 dominates the plot. We can see entries even as far back as 2009! This was before the Internet Research Agency even existed.
The account categories provided by Linvill and Warren
The categories that Linvill and Warren created by manually checking each user provides a extra touch of possibilities in the first dataset. They have placed all the users into seven account categories, based on the content of their tweets. Their description of them are as follows:
- NonEnglish: Mainly tweets in other languages than english.
- RightTroll: Mimics Trump supporters, often anti-immigrant.
- LeftTroll: Mimics Black Lives Matter-activists. Tries to divide the democratic party.
- NewsFeed: Aggregates local American news. Mostly links to real content.
- HashtagGamer: Hashtags all the time and participates in hashtag games.
- Fearmonger: Creates fake news and tries to spread fear. Most of them actually attacks Koch Foods.
- Commercial: Only commercial content.
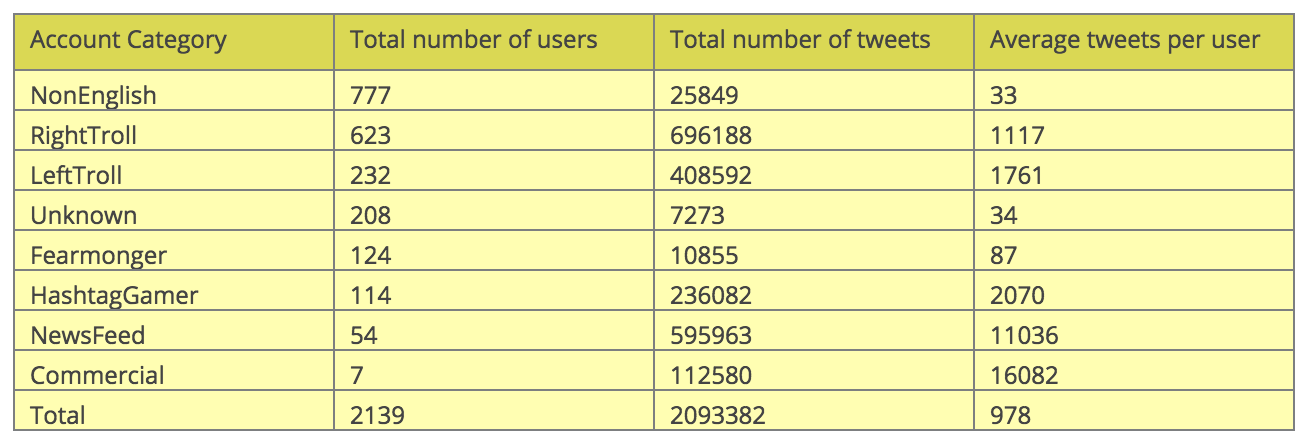
The amount of tweets from the NonEnglish users is skewed, since these tweets are the NonEnglish users’ tweets in English. They can’t be viewed as a representation of all the NonEnglish users.
Most of the accounts were created over a time period in 2015. A few spikes stand out, for example that many of the “other” accounts like NewsFeed and HashtagGamer were created in May 2015. The same month had a high spike of right troll tweets, but the highest amount of Right Trolls came in the summer of 2017, leading up to the events in Charlottesville.
Most active and popular users
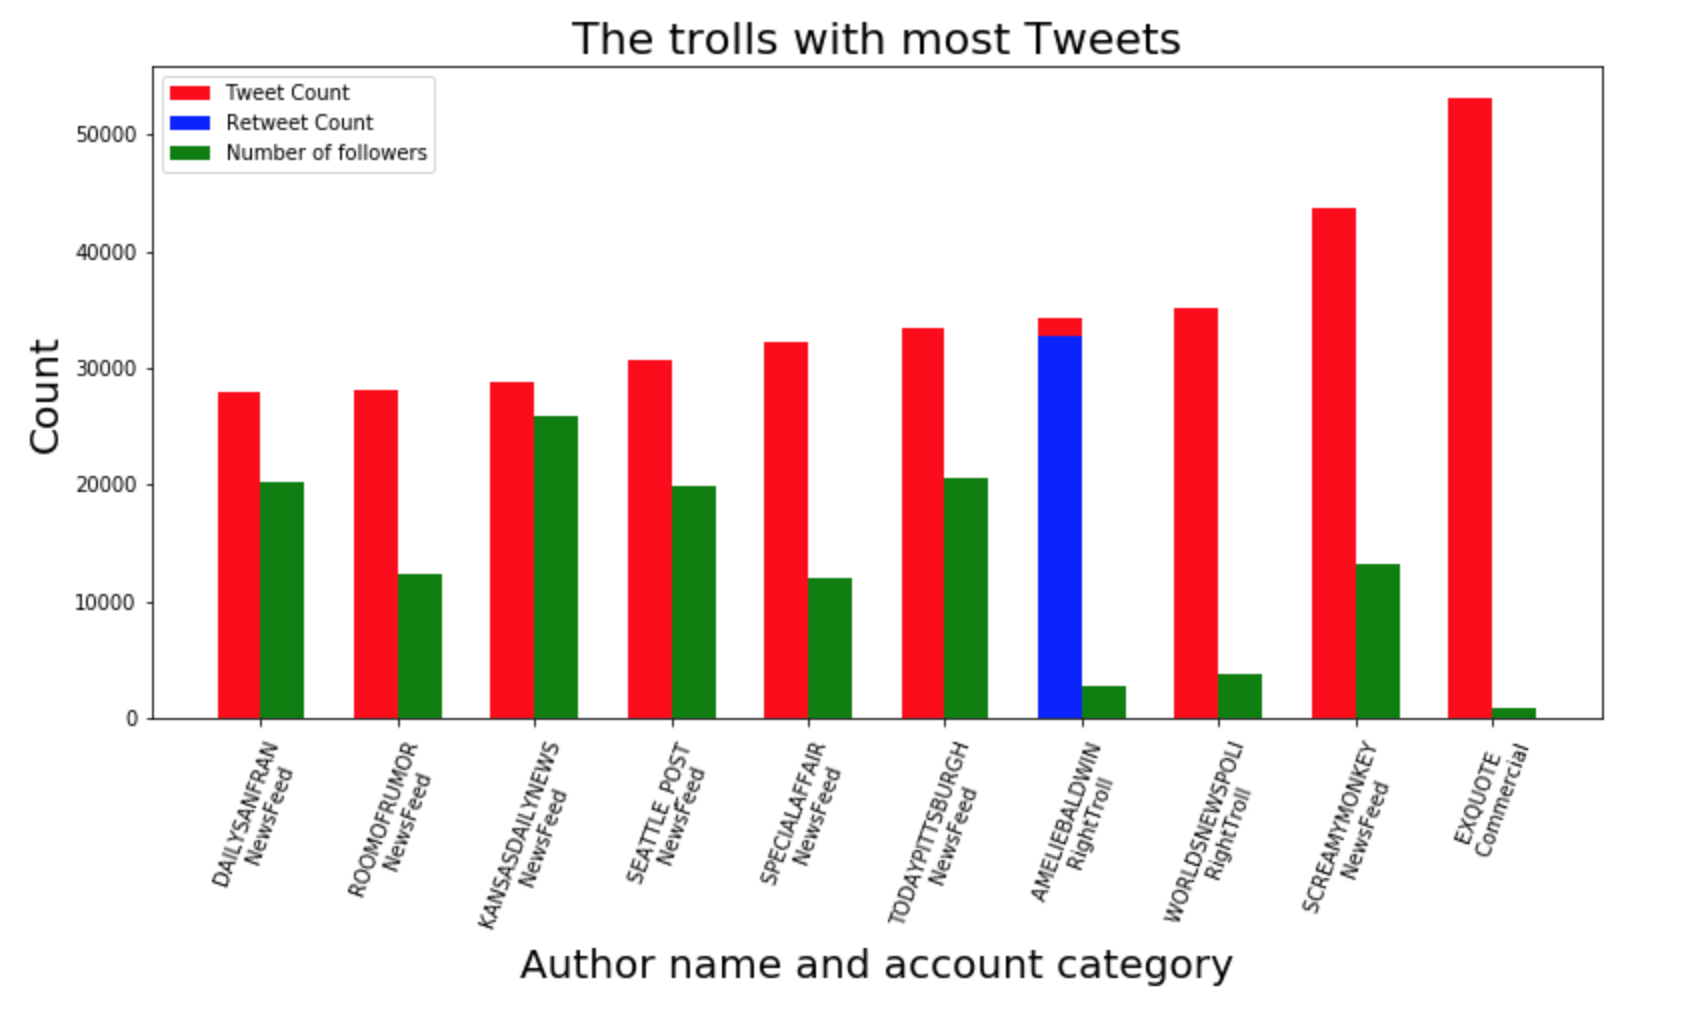 Some of the top accounts in the dataset tweet at an enormous scale. Most of these are NewsFeed, spreading news disguised as some local institution. In most cases, the news are legitimate and links to real news sources (The tweets in their original form can still be found here). This tactic may be to invoke doubt about whether social media news channels can be seen as trustworhty, but it is hard to say for sure.
It’s interesting to notice that almost none of the top 10 retweet at all, except AMELIEBALDWIN which almost exclusively retweets.
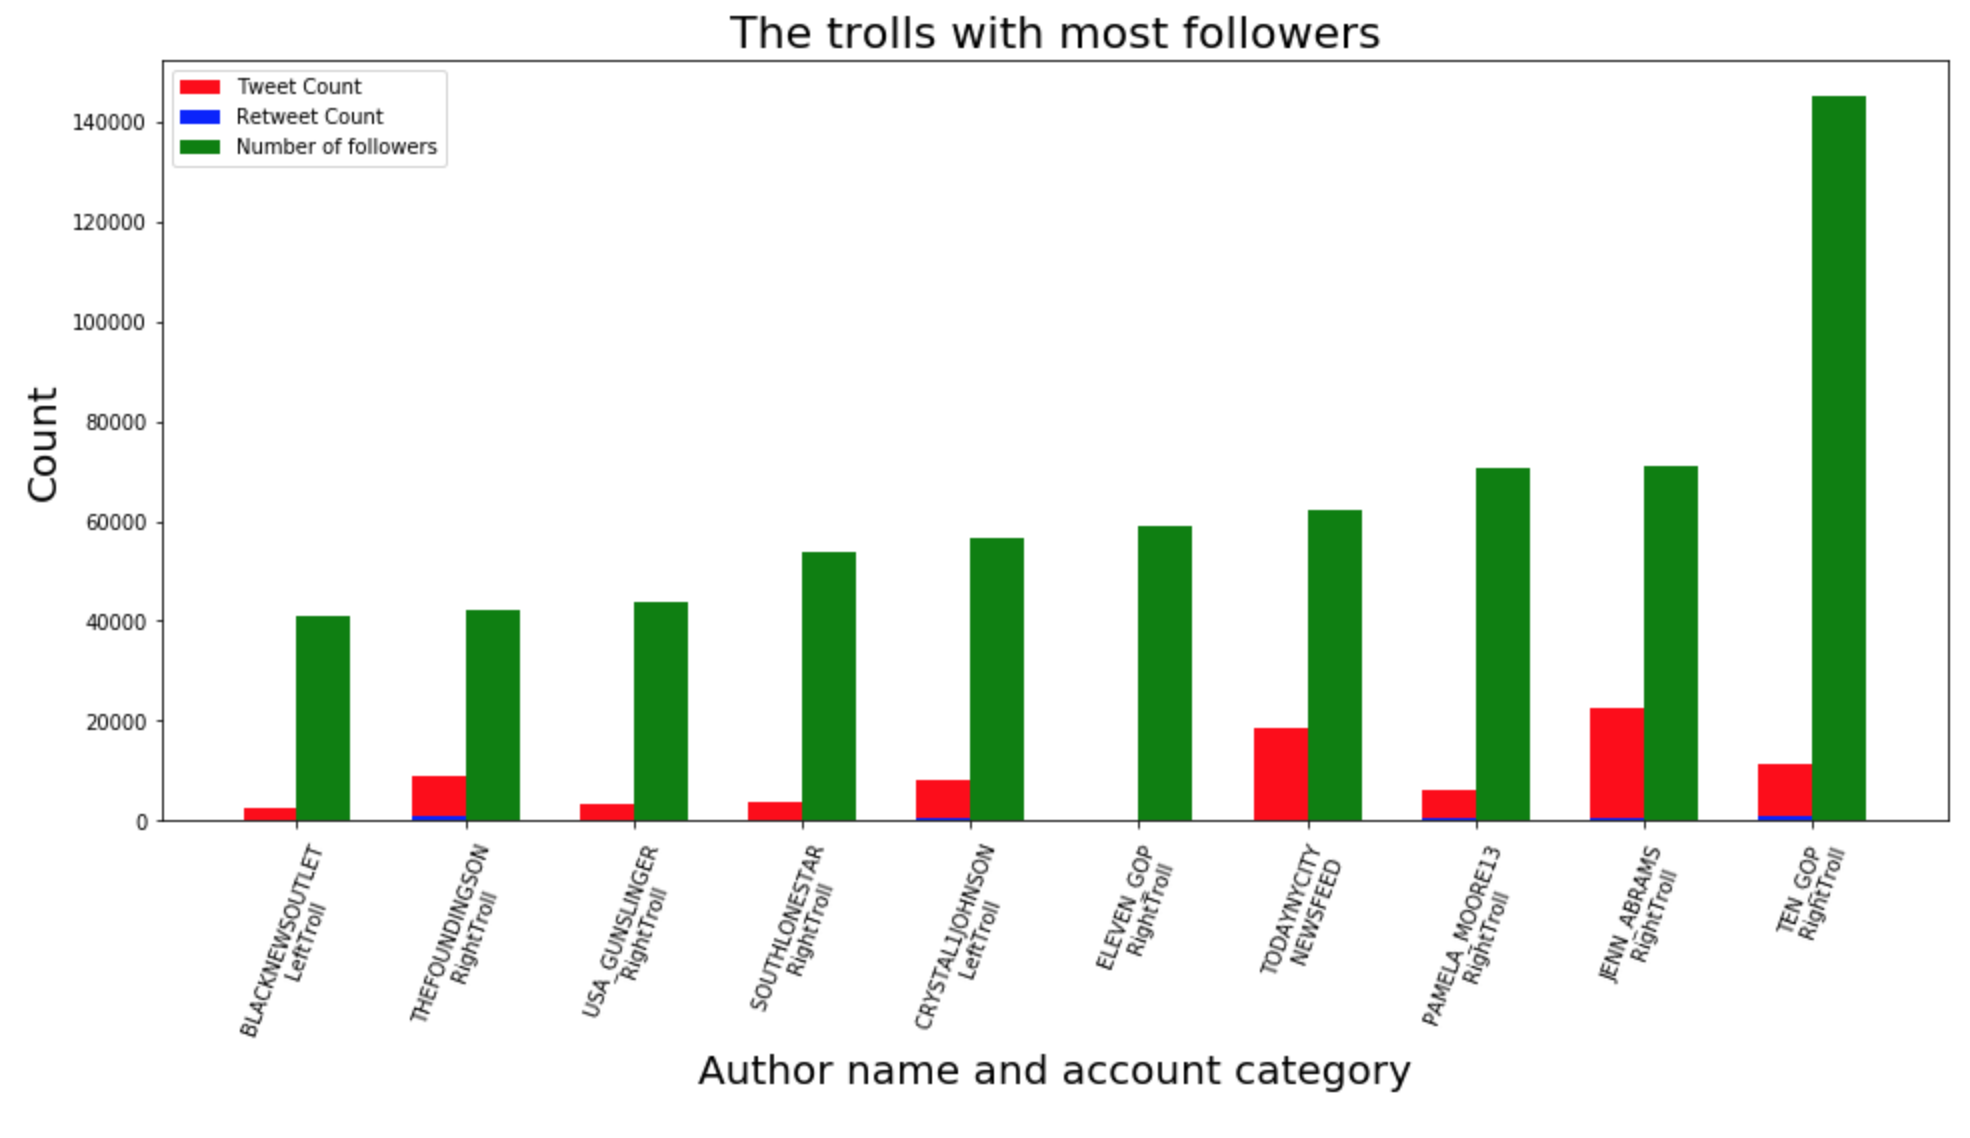 Many of the accounts had a huge amount of followers. On this scale it is fully possible to be viewed as a serious tweeter. The author CRYSTAL1JOHNSON for example, is a LeftTroll that was frequently retweeted, even 17 times by Twitter’s own creator, Jack Dorsey. Donald Trump personally thanked TEN_GOP for a supporting tweet. This proves that the trolls can have serious influence on social media. Most of the top 10 most followed users are labeled RightTroll.
We can see that one could get a lot of popularity regardless of being the most frequent tweeter. Popularity on Twitter is often gained by being retweeted by other popular accounts, and to get retweeted 17 times by Twitter’s own creator surely helps. The reason why ELEVEN_GOP has so many followers is because it was the backup account of the most popular user, TEN_GOP. This explains the amount of followers in spite of having having only 101 tweets.
The most popular authors do not retweet often, as we barely can see the blue retweet count in any of the top 10 authors.
Most interacting users
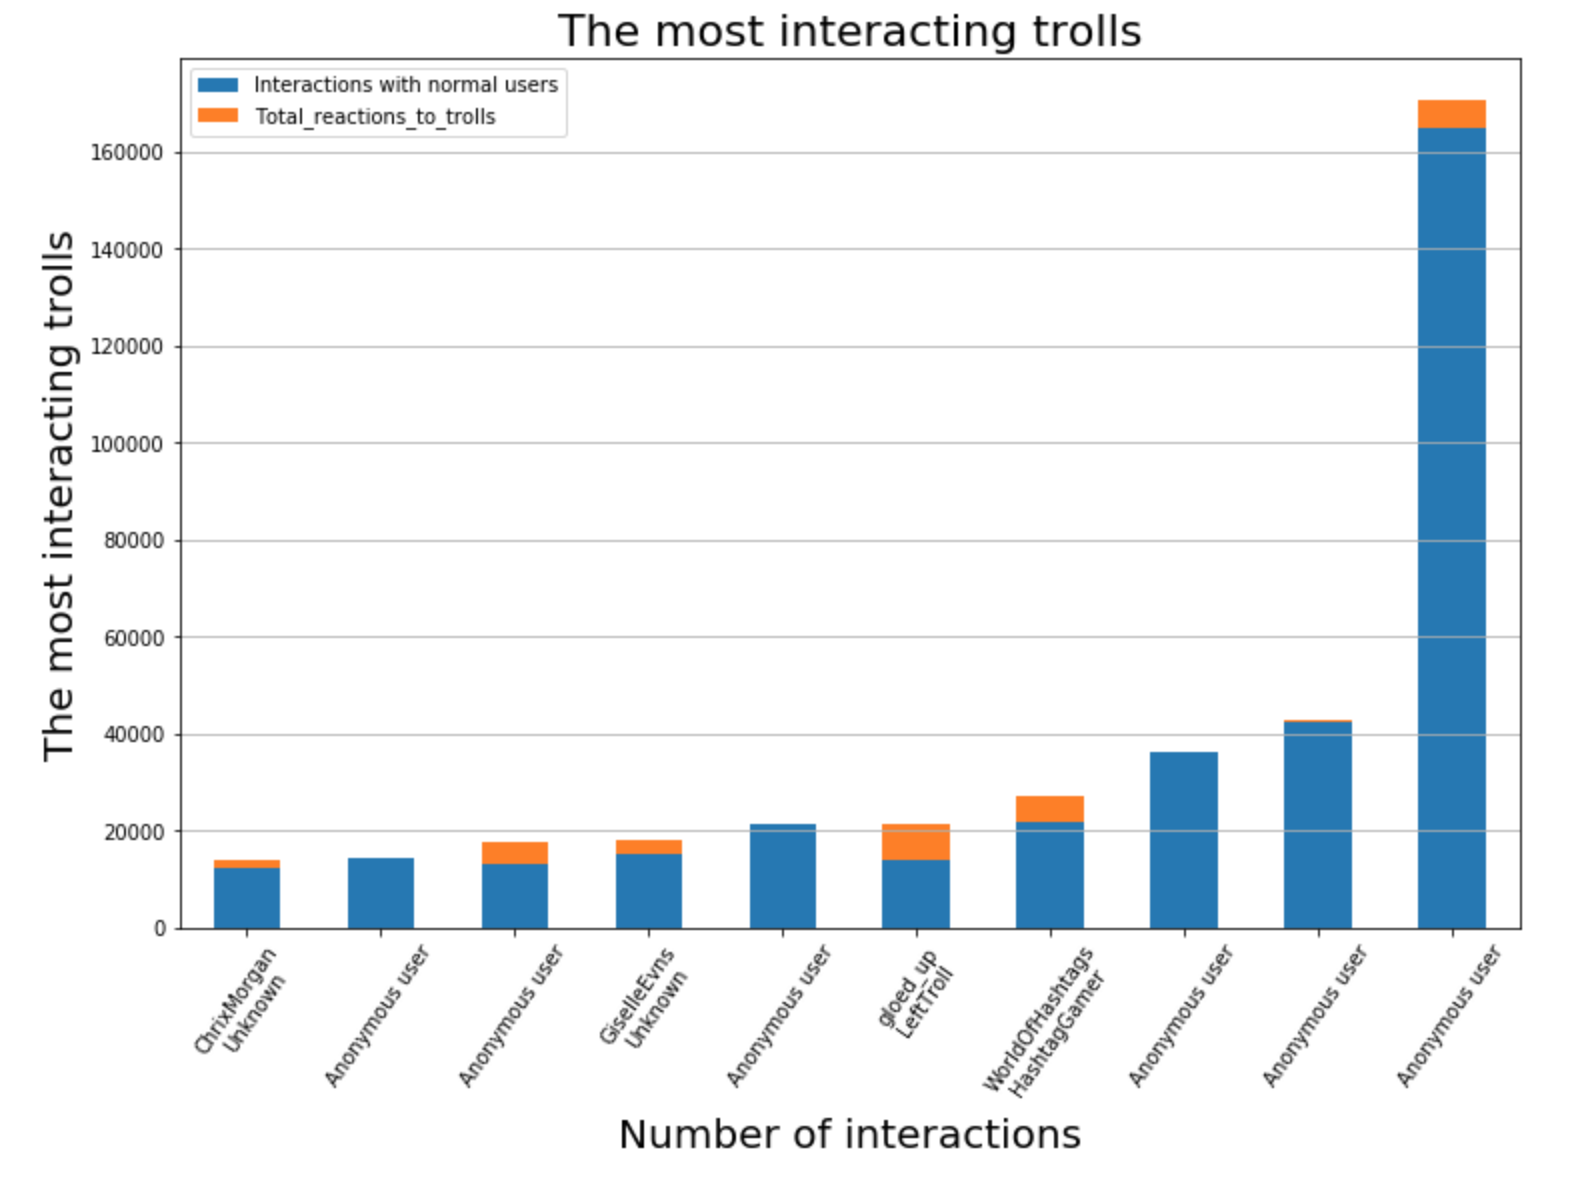 These are the users that interacts the most to others. Interacting can mean retweeting, replying or quote tweeting someone. You can also have two interactions in one tweet. To get the full grip of how this work you can read part 3.4 in our working notebook.
For the previous and the following figure, the orange part of the stacked bars represents how many tweets the user has that is direct interactions to other trolls in the dataset.
Most of these users were hashed in the dataset so we don’t know their names. One user stands out with over 160000 interactions (this does not mean 160000 unique users reached). This is the user that nearly had 160000 tweets, meaning that this user is a mastodont of an interacter. Interestingly, he is doing it mostly to normal Twitter users.
Some of the users have a significant number of interactions going towards other trolls.
Users that have been interacted with the most
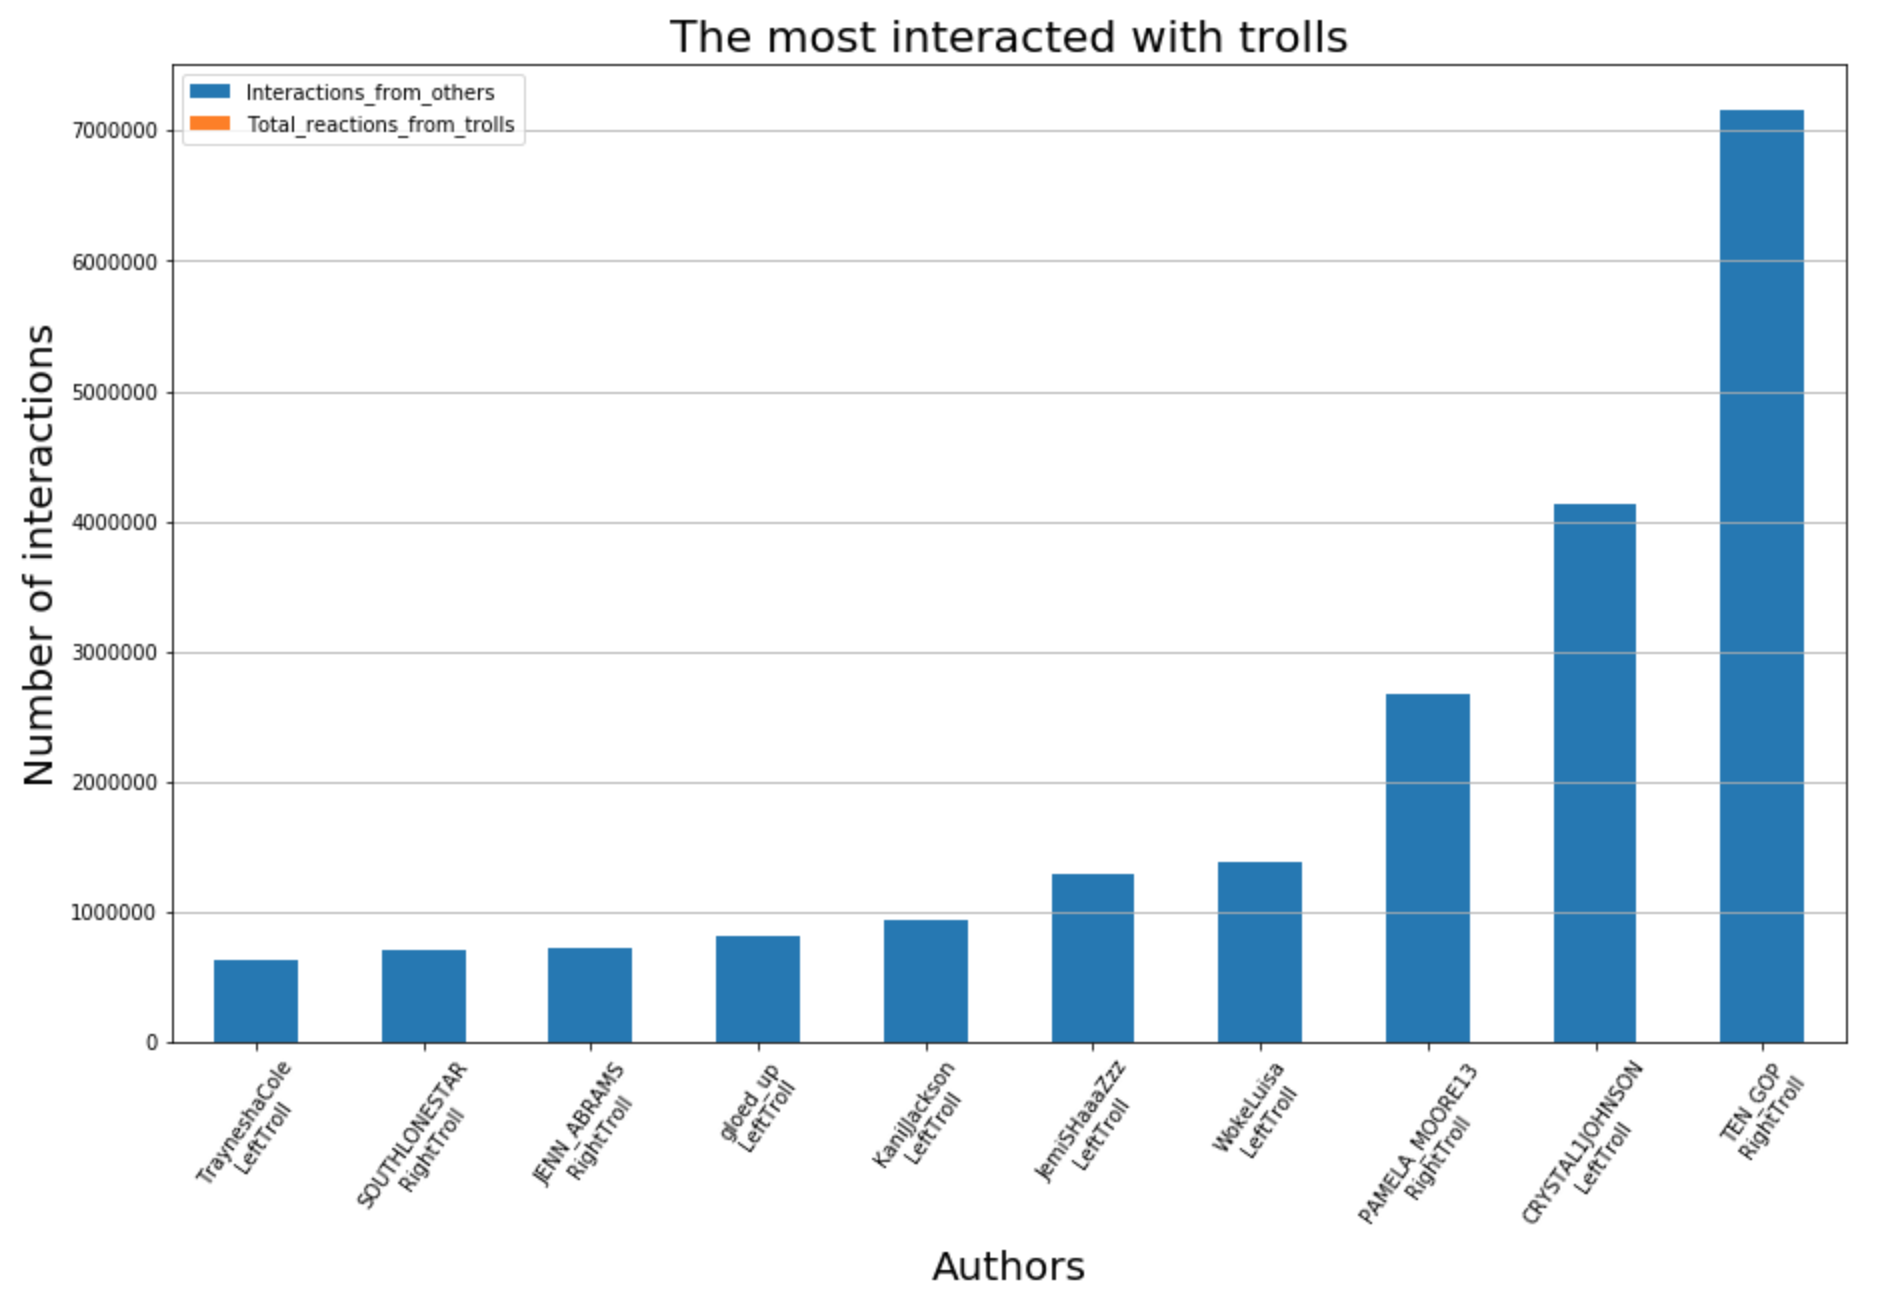
It is clear that the users that have been interacted with the most have a so small fraction of troll interactions that it is invisible in most cases. This is likely due to reaching out to so many people that the trolls interacting with these users are basically outnumbered. It may also be that at some point, if the users get popular enough, IRA trolls stops interacting with theses users to mitigate suspicion towards the users.
It’s also interesting to see that all of these users are trolls with a political leaning, meaning that the users in a political category are the ones that have the broadest reach of the trolls.
Was this interesting? Check out our further analysis: